
Clients
यह पेज अभी हिंदी में उपलब्ध नहीं है, इसलिए अंग्रेज़ी में दिखाया गया है।
Reports > Clients answers “are people coming back, and who do I need to reach?” It replaced the old Customer Analytics page.
Open Clients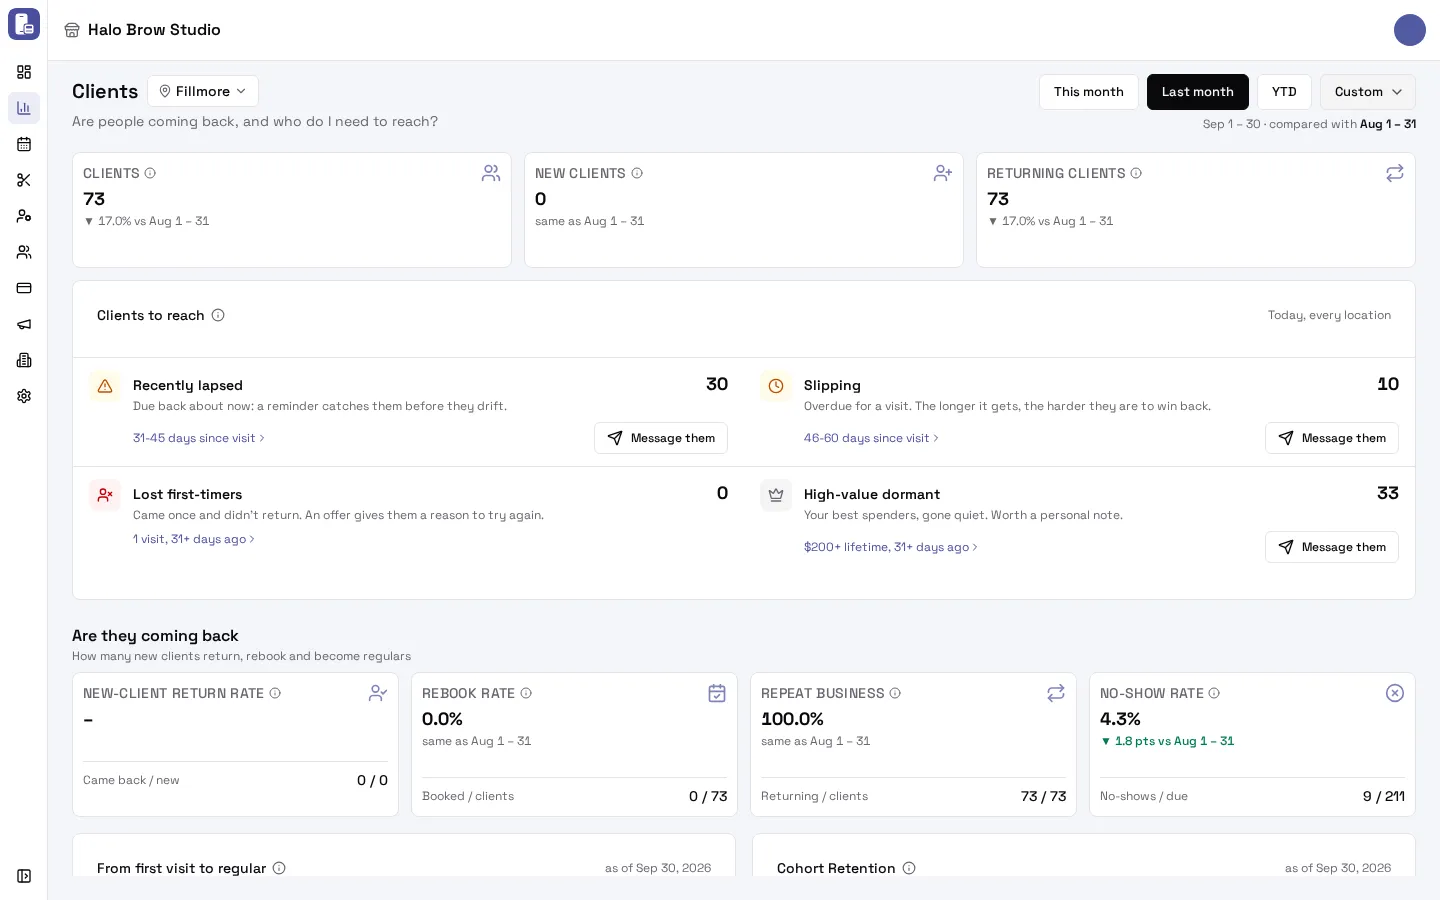
Pick the range and location at the top, as on Sales.
What do the top tiles mean?
Section titled “What do the top tiles mean?”- Clients: different people with a completed visit in the range (walk-ins without a client record aren’t counted).
- New clients: their first completed visit at your business is in the range.
- Returning clients: they had a completed visit before the range.
Who should I reach out to?
Section titled “Who should I reach out to?”Clients to reach lists four groups of real clients, counted today, across every location (whatever range you picked):
| Group | Who | Why now |
|---|---|---|
| Recently lapsed | Last visit 31–45 days ago | Due back about now: a reminder catches them before they drift |
| Slipping | Last visit 46–60 days ago | Overdue: the longer it gets, the harder to win back |
| Lost first-timers | One visit, 31+ days ago | Came once and didn’t return: an offer gives them a reason |
| High-value dormant | $200+ spent in total, 31+ days since their last visit | Your best spenders, gone quiet: worth a personal note |
- Tap the line under a group (for example “31-45 days since visit”) to see those clients in your client list.
- Tap Message them to send that group a text. It opens a one-time send with the group already picked, showing how many of them can get texts.
Are clients coming back?
Section titled “Are clients coming back?”Are they coming back has four rates, each compared with the period before (in percentage points):
- New-client return rate: of the range’s new clients, how many have come back since. This is the number to grow. A past range’s figure keeps growing as clients return.
- Rebook rate: of the range’s clients, how many have a visit booked right now.
- Repeat business: of the range’s clients, how many had been before.
- No-show rate: of the visits that should have happened, the share where the client didn’t come.
Under them: From first visit to regular (had a first visit → came back for a 2nd → regulars with 4+ visits) and Cohort Retention (of the clients who started in each month, how many came back in later months).
How do clients book?
Section titled “How do clients book?”The growth section shows New and returning clients over time and How clients book: Online (your booking site), Staff (booked by your team for a later time), the mobile app and walk-ins.
What’s in More details?
Section titled “What’s in More details?”Tap More details for money from new versus returning clients, more rates (such as the upsell rate), Customer Segments, Value vs Frequency Matrix, Days Since Last Visit, Visit Frequency Distribution and Customer Value Distribution. These describe your client base as of the range’s end (the card says “as of …”). Click a segment, bar or dot to open those clients.
Troubleshooting
Section titled “Troubleshooting”Why does the group count differ from the chart below?
Section titled “Why does the group count differ from the chart below?”Clients to reach is always today and every location. The charts follow the range and location you picked. Pick All locations and a range ending today to compare them.
Why is New clients 0?
Section titled “Why is New clients 0?”Nobody had their first ever completed visit at your business in that range. Clients who visited before the range count as returning, even if they hadn’t been in a long time.
Why do the numbers differ from the old Customer Analytics page?
Section titled “Why do the numbers differ from the old Customer Analytics page?”A client whose first visit is in the range now counts as new on all their visits in it. Day buckets now start at 31 days (the old page used 30). Revenue is after refunds and without tips, as on Sales.
Can I export this report?
Section titled “Can I export this report?”Not as a file. To work with a group of clients, tap it to open them in your client list, or use Message them. For sales figures, use Export CSV on Sales.