
Sales
Reports > Sales answers “how much did we make, and from what?” for any range of days. It replaced the old Revenue Dashboard and Business Reports pages: old links open it.
Open Sales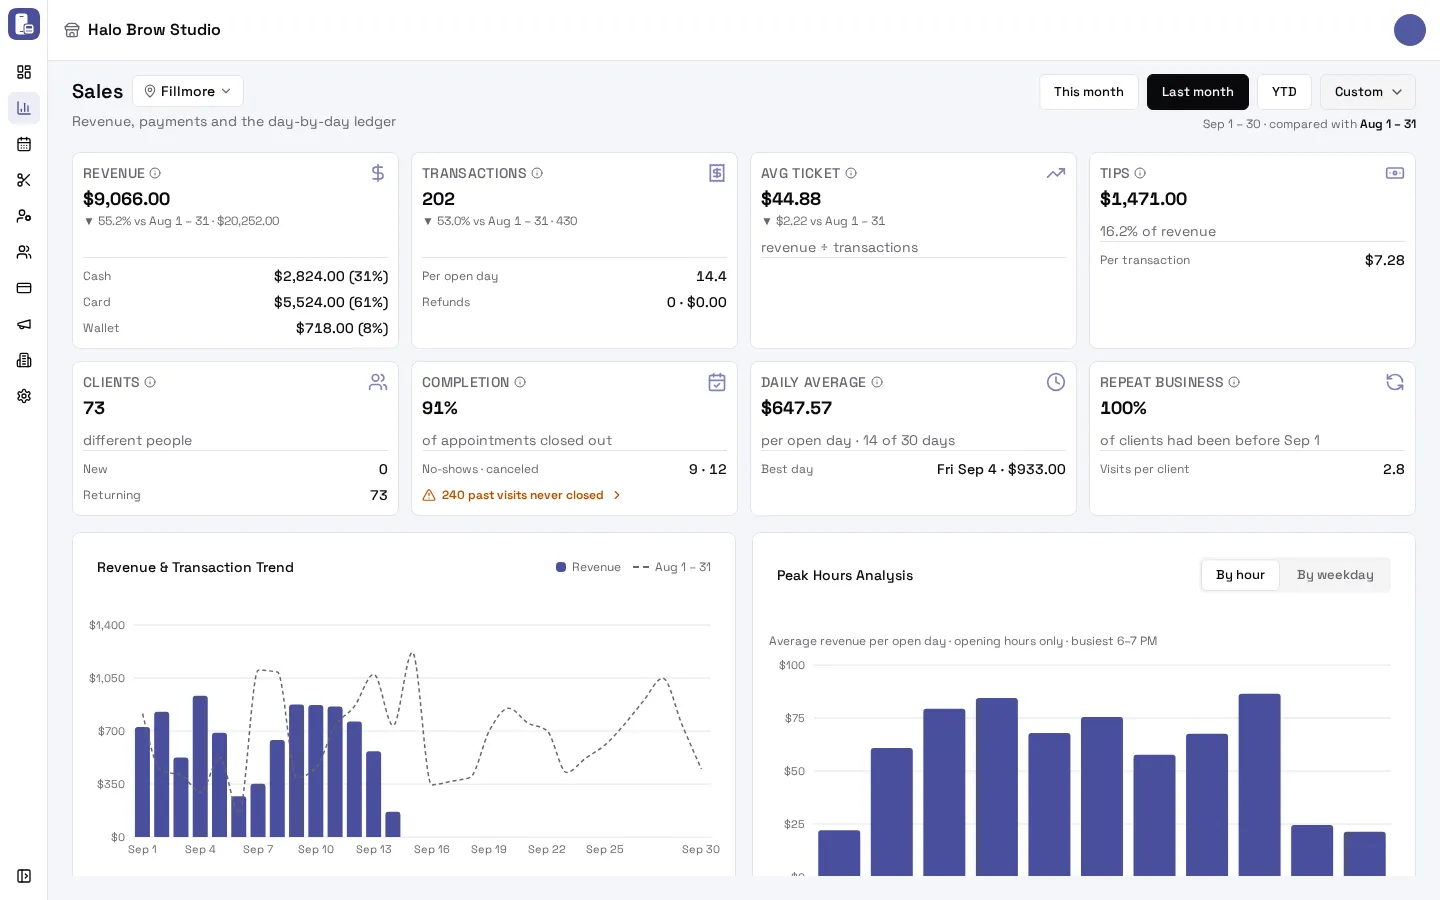
How do I pick the dates and location?
Section titled “How do I pick the dates and location?”- Range: tap This month, Last month or YTD (year to date), or Custom for Today, Yesterday, Last 7 days, Last 30 days or any dates. Under the buttons it says what you’re comparing with, for example “Sep 1 – 23 so far · compared with Aug 1 – 23”.
- Location: the picker next to the title. All locations shows the whole business.
The range and location carry over when you switch to Clients, Team or Services. On a phone, switch reports with the buttons at the top.
What is it compared with?
Section titled “What is it compared with?”- One day: the same weekday a week before.
- A whole month: the whole month before.
- Part of a month from the 1st (like “This month”): the same days last month.
- Year to date: the same days last year.
- Anything else: the same number of days just before.
Up is green. Down or level is grey, never red.
What do the tiles mean?
Section titled “What do the tiles mean?”Hover over (or tap) the ⓘ next to a tile for its definition.
| Tile | What it shows |
|---|---|
| Revenue | Sales after refunds, without tips, split by Cash, Card, Wallet (when used) and Other |
| Transactions | Payments taken, per open day, and refunds (count · amount) |
| Avg ticket | Revenue ÷ transactions |
| Tips | Tips after refunded tips, their share of revenue, and per transaction |
| Clients | Different people with a completed visit, split into New and Returning |
| Completion | Of the visits closed out, the share completed, with no-shows and cancellations |
| Daily average | Revenue per open day (a day with at least one sale), and your best day |
| Repeat business | Share of the range’s clients who had been before it started, and visits per client |
An amber “N past visits never closed” on Completion means visits from earlier days are still scheduled or checked in. Tap it to open them and finish or cancel them.
What are the charts?
Section titled “What are the charts?”- Revenue & Transaction Trend: revenue per day, with the comparison period dashed. Click a day to open that day’s payments. One- or two-day ranges show revenue by hour.
- Peak Hours Analysis: By hour shows your average revenue per open day for each hour and the busiest hour. By weekday shows a weekday × hour grid. Use it to plan staffing.
- Transaction Insights: how you were paid, refunds, and Discounts given.
- Top services and Top staff: the top five, with links to the full Services and Team reports.
What is in Details?
Section titled “What is in Details?”Under the charts, Details is the ledger behind the numbers, for the same range:
- Days: a row per day with transactions, net sales, gross sales, refunds, tips, cash, card and other, new clients, completed visits, no-shows, canceled, average wait and service time, hours clocked and sales per hour. A day opens that day’s payments.
- Services: each service’s times done, listed value, sales, discounts & refunds, average price, share and rating.
- Staff: each person’s service sales, tips, services, appointments, clients, hours, sales per hour and rating.
The totals row sits at the top. Click a column name to sort. An amber Missing clock-out badge means a clock-in was never closed, so those hours count 0 until it’s fixed in Work history.
How do I export my sales?
Section titled “How do I export my sales?”- Pick the range and location.
- Scroll to Details and choose the Days, Services or Staff tab.
- Press Export CSV.
You get a spreadsheet file of that table (rows in the same order, then the totals), named like sales-days-fillmore-2026-09-01-to-2026-09-30.csv. Amounts are plain numbers in dollars, ready for your bookkeeper. The Services report has its own Export CSV, and card processing statements download as a PDF.
Why don’t the numbers match what I saw before?
Section titled “Why don’t the numbers match what I saw before?”The reports were rebuilt in October 2026 and count money the same way everywhere:
- Cash basis: a sale counts on the day it was paid, not the day of the appointment. A visit on the 30th paid on the 1st counts in the new month.
- Refunds count on the day they’re made, not on the day of the sale.
- Revenue never includes tips. Tips are their own tile.
- Service sales (Top services, the Services tab) count on the visit’s day and only what was paid for each service, so they don’t always add up to Revenue.
- A clock-in left open on a past day counts 0 hours until it’s corrected.
Why doesn’t revenue match my bank deposit?
Section titled “Why doesn’t revenue match my bank deposit?”Your bank deposit and your revenue are different things:
- Cash is in revenue but never in a card deposit.
- Tips paid by card are in the deposit but not in revenue.
- Card fees are taken out by Fiserv, so the deposit is smaller. Monthly-billed fees come out in one charge early the next month.
- Timing: card sales settle in a nightly batch and deposits arrive 1 to 2 business days after settlement, so a Friday’s sales can land on Monday or Tuesday.
- Refunds and chargebacks are taken from a later deposit.
To match your bank, use Statements: it shows what Fiserv funded on each date, with fees and batches.
Troubleshooting
Section titled “Troubleshooting”The report is empty
Section titled “The report is empty”Check the range and the location. “No sales yet today” or “No sales Sep 1 – 14” means no completed payments in that range at that location.
Some names show as “Employee #12” or “Custom service”
Section titled “Some names show as “Employee #12” or “Custom service””“Custom service” is an off-menu item added to a visit. “Employee #…” is someone who no longer works at the location you picked; choose All locations to name everyone.
I can’t see Reports
Section titled “I can’t see Reports”You need permission to see reports. Ask the business owner (see Members).